US electricity emissions are halfway to zero
(Hey Volties! The following was going to be a column on Vox, but they decided they wanted something newsier, so I’ll be doing something about Biden’s pledge over there, soon. In the meantime, enjoy this writeup of a fun new paper, or listen by clicking play above. We’ll get back to Battery Week next week.)
Climate change can sometimes seem like an intractable problem, so it is useful to remember periodically that progress is possible — indeed, that we are making progress, and know how to make more.
This is especially true of the electricity sector.
Electricity is the focus of some of our biggest ambitions. Climate policy analysts (and Joe Biden) agree that we need to decarbonize the electricity sector entirely by 2035 — that’s what Biden’s Energy Efficiency and Clean Energy Standard aims for, if he’s able to pass it.
That’s an incredibly ambitious target for the next 15 years, but a look at the last 15 years shows that rapid change is possible.
The US electricity sector is decarbonizing faster than expected
To illustrate the point, Lawrence Berkeley National Laboratory senior researcher Ryan Wiser undertook a simple project. He went back 15 years and looked at the US Energy Information Administration’s 2005 projections for the electricity sector, to compare them with what actually happened.
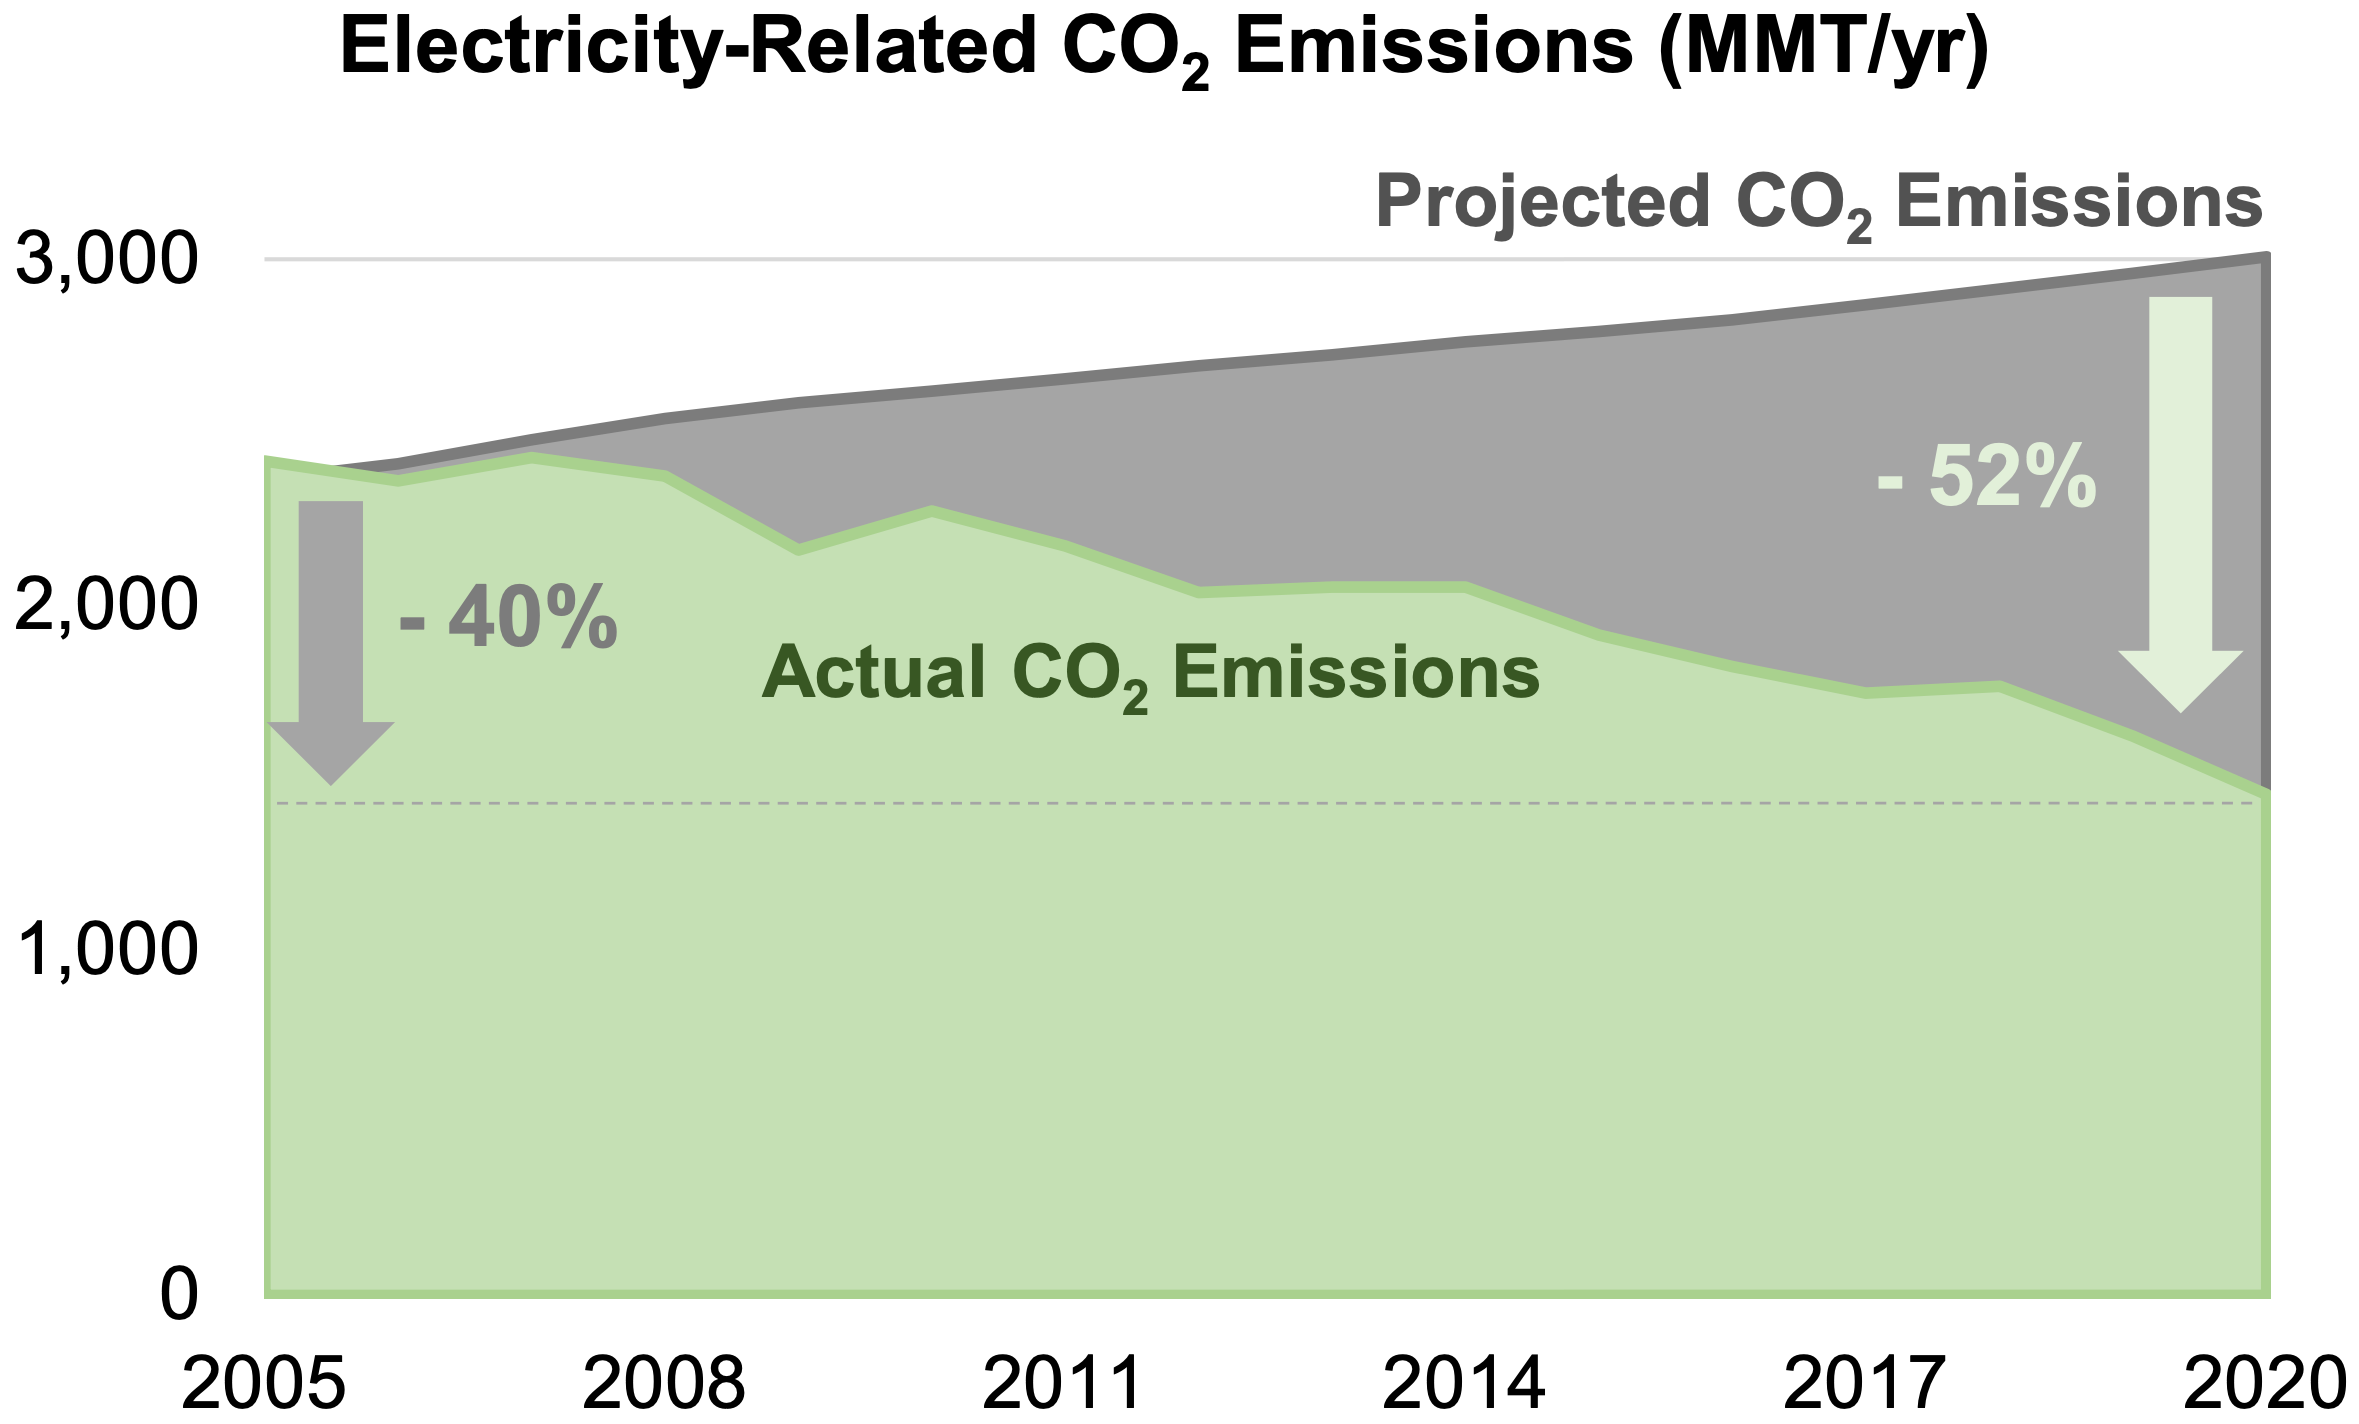
Specifically, he looked at the EIA’s business-as-usual (BAU) scenario, its projection of what would happen if 2005 policy were frozen in place. (He also looked at other projections, to make sure EIA wasn’t an outlier.) Here’s the top-line conclusion:
Fifteen years ago, many business-as-usual projections anticipated that annual carbon dioxide (CO2) emissions from power supply in the United States would reach 3,000 million metric tons (MMT) in 2020. In fact, direct power-sector CO2 emissions in 2020 were 1,450 MMT — roughly 50% below the earlier projections. By this metric, in only 15 years the country’s power sector has gone halfway to zero emissions. [my emphasis]
Not bad!
Of course, as Wiser acknowledges, this is about the rosiest possible lens through which to look at this data.
2020 was an unusual year; the pandemic drove demand (and emissions) down. Using 2019 numbers instead, the decline from BAU is 46 percent.
If you measure how much power sector emissions fell from 2005 to 2020 in absolute terms — rather than relative to expectations — the decline is 40 percent. Measuring absolute decline with 2019 numbers gets you 33 percent.
If you look at total energy-related emissions — not just electricity but all energy — they are down 39 percent relative to BAU. It’s evident that electricity is making the fastest progress.
Nonetheless, no matter how you look at it, in terms of emissions, we’re doing much better than BAU in the electricity sector.
Here’s a breakdown of emission declines in the electricity sector (and its component subsectors), relative to BAU projections and absolute levels, for both 2020 and 2019.
(Look how much difference 2020 made in transportation — that’s the pandemic talking.)
That’s how electricity GHG emissions did. Let’s look at a few other metrics.
Coal died while natural gas and renewables grew
Four big trends in the sources that power the electricity sector helped push emissions below BAU.
First, coal died — just absolutely plunged relative to expectations. Second, natural gas boomed, thanks to the shale revolution, and stayed much cheaper than expected. Third, renewables boomed, thanks to policy support that drove rapid cost declines. And fourth, demand stagnated, thanks to declining manufacturing and energy efficiency.
Here’s a graph that shows, on top, how supply and demand sources came in relative to EIA’s 2005 BAU, and on bottom, how they performed in absolute terms.
You can see the four stories plain as day: coal plunged, natural gas and renewables boomed, and demand stagnated.
Here’s another way of looking at the data:
Electricity bills have not increased …
The dynamic in electricity prices is interesting.
EIA’s 2005 BAU projection had electricity retail prices falling slightly by 2020, but average consumer electricity bills rising substantially, thanks to increased demand. What happened instead: retail prices stayed about the same, and so did average bills.
With all the cheap natural gas and renewables flooding the system, why didn’t prices go down? Wiser cites research uncovering the primary culprit: “declining power production costs due to decreasing prices for natural gas, wind, and solar have been offset by increases in sector-wide transmission and distribution costs.”
Curses, transmission again! (Time to spend some infrastructure money.)
… but pollution has plunged
Coal is the dirtiest electricity source, so the unexpected plunge in coal means a commensurate plunge in local air pollutants and greenhouse gases.
Wiser calculates both the climate damages (by using the government’s social cost of carbon) and the air pollution damages avoided by sectoral changes over the last 15 years. They are stunning.
Even these numbers probably understate the benefits, since every new round of science reveals that the impact of air pollution is greater than previously understood.
Employment grew thanks to renewables
“The renewable energy sector is job-intensive, requiring more jobs per unit output than natural gas and coal,” Wiser writes. “As a result, though jobs in the coal sector are considerably lower than might have been the case, natural gas and especially renewable energy jobs boost the overall total to 920,000.”
Measuring employment impacts is a little trickier — Wiser only measures a limited set of job categories, and calls these “rough first-order approximations” — but it’s clear enough that domestic renewable energy also involves lots of new domestic jobs.
What to learn from our unanticipated success in electricity
What’s happened over the past 15 years in US electricity is remarkable: for no added cost to consumers, we have radically reduced the social cost of power. Hundreds of thousands of people, maybe millions, will be healthier in the future for it.
In part that came through a few strokes of luck. The fracking boom was responsible for somewhere around half the reductions. But a great deal came through organized activist and public-policy effort, to push coal out of the system, expand renewables, and hold demand down through energy efficiency. (Given how much research and public policy was devoted to expanding natural gas, even that could be seen as largely intentional.)
When I asked Wiser how much credit he would give to deliberate policy, here’s what he told me:
Policy has driven growth in wind, solar, and energy efficiency. For wind and solar, state RPSs, federal tax incentives, net metering, R&D. For efficiency, efficiency standards for equipment and buildings and utility energy-efficiency incentives. As it relates to renewables and efficiency, the glory goes to policymakers, and also to innovators in many cases directly or indirectly supported by policy.
For coal to gas switching, the story is more nuanced. Surely fracking was developed in part with federal government assistance. Aswell, pressure campaigns by many advocates have supporte
You May Also Like

Was jetzt?
DIE ZEIT

Asmongold TV
Asmongold TV

5/7 Le Morning RMC
RMC

The Derek Hunter Podcast
Derek Hunter

SBS Vietnamese - SBS Việt ngữ
SBS

Forklart
Aftenposten

The Bunker – News without the nonsense
Podmasters

DW News Brief
DW

Las noticias de la SER
SER Podcast

Bloomberg Daybreak: Asia Edition
Bloomberg
Was jetzt?
DIE ZEIT
Asmongold TV
Asmongold TV
5/7 Le Morning RMC
RMC
The Derek Hunter Podcast
Derek Hunter
SBS Vietnamese - SBS Việt ngữ
SBS
Forklart
Aftenposten
The Bunker – News without the nonsense
Podmasters
DW News Brief
DW
Las noticias de la SER
SER Podcast
Bloomberg Daybreak: Asia Edition
Bloomberg
Community discussion